
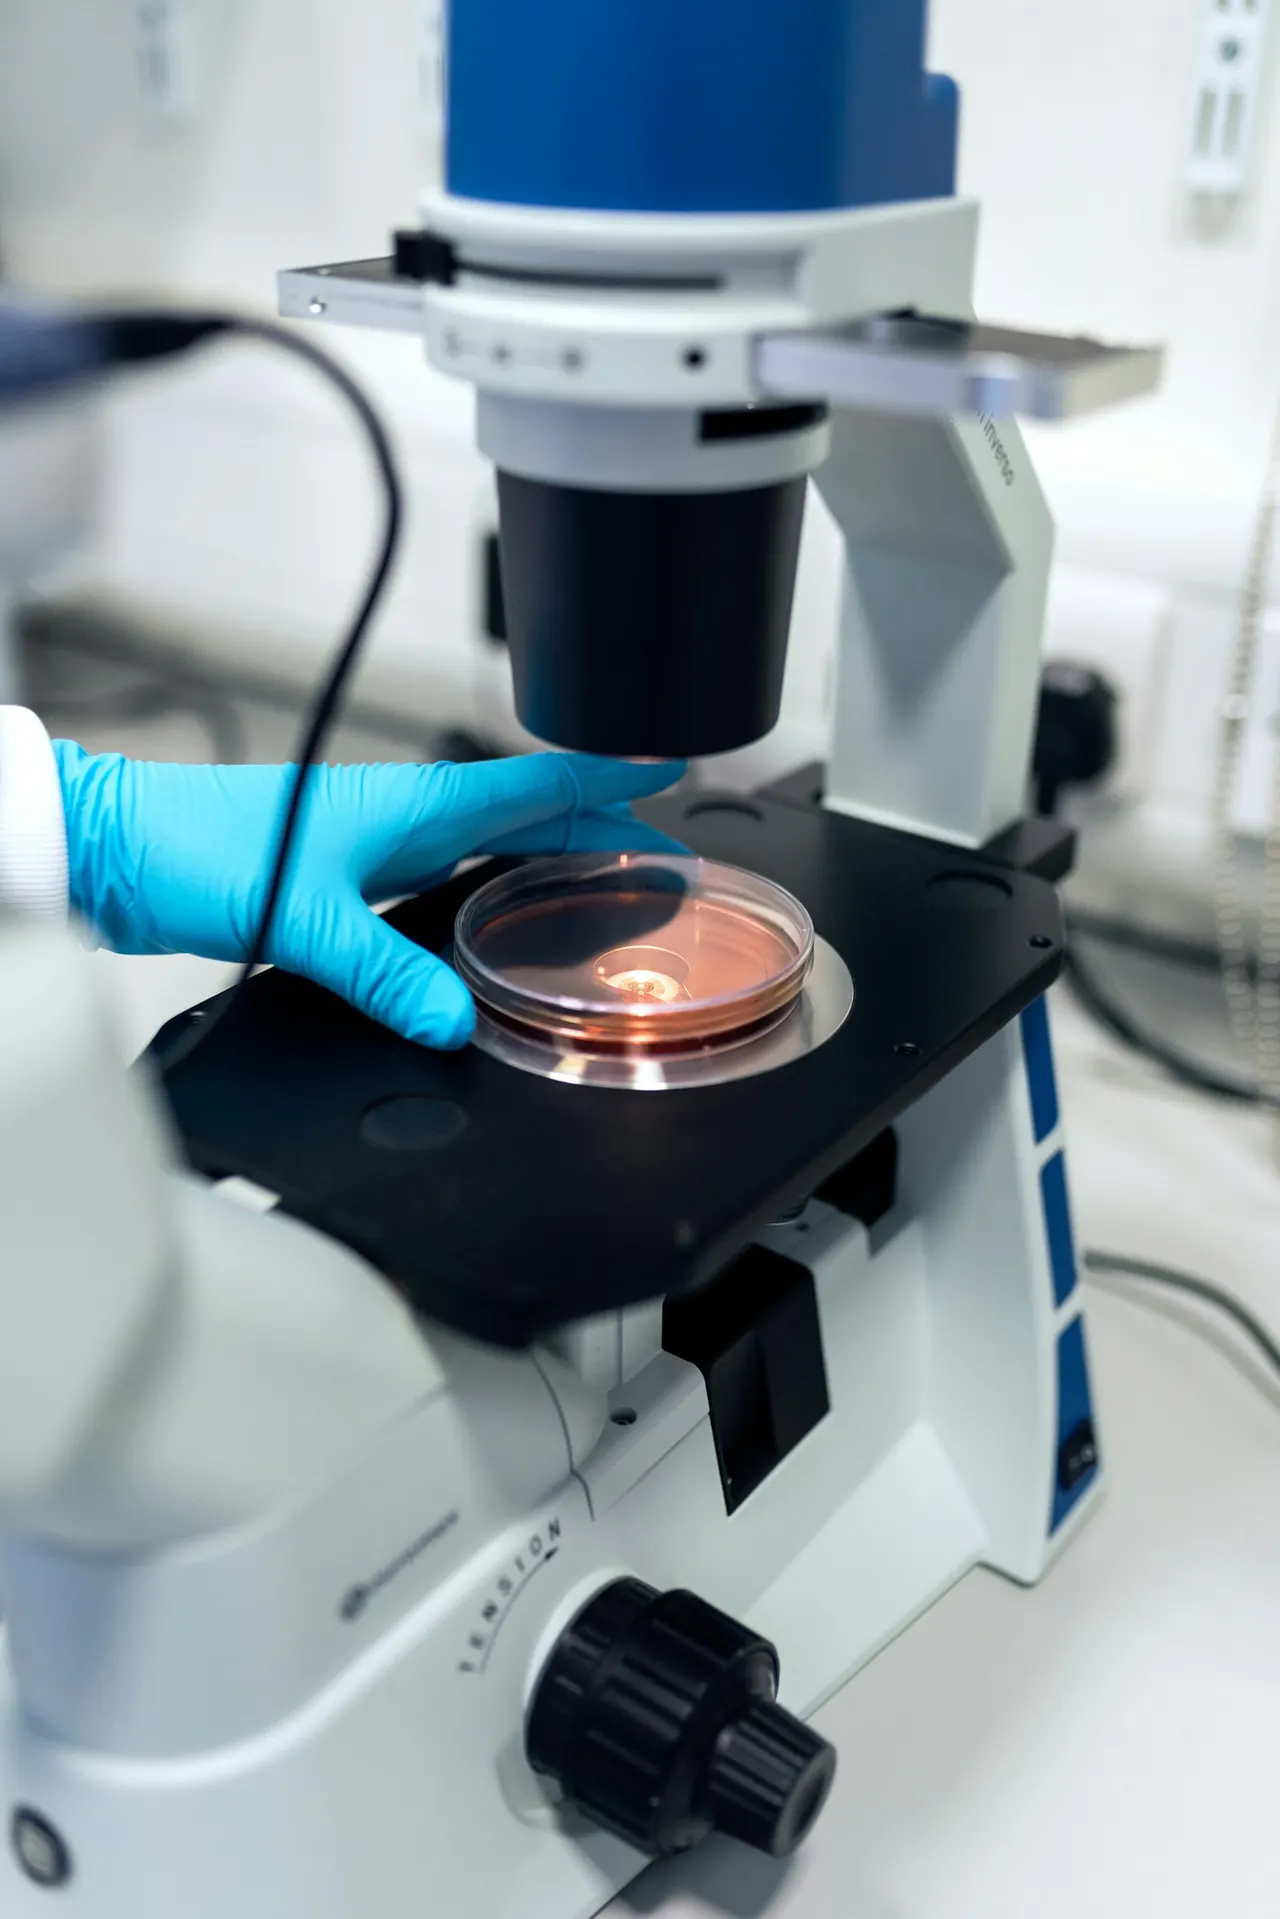
Hydrogel scaffold and implant degradation testing
GelTech Labs follows hydrogel scaffolds and degradable implants from first fluid uptake to resorption on the same samples, with a continuous mass curve beside ASTM F1635. Your team sizes the degradation window and picks the polymer with confidence.
Discuss a pilot studyFewer samples spent, and better scaffolds reaching patients sooner
A scaffold or implant has to carry load until new tissue takes over, then resorb. Finding the polymer that does takes many runs on scarce samples. Fewer dead ends means better implants and scaffolds reach patients sooner.
- Fewer samples, less bench time
- Carousel follows the same samples around the clock, after 10 to 20 minutes of setup.
- Real differences stand out
- 3x higher precision than manual methods, so a real difference between crosslink densities shows.
- A degradation window you can size
- One unbroken curve per sample shows when swelling peaks and mass loss begins.
One set of samples, one unbroken curve
Carousel adds a wet-mass curve beside ASTM F1635, the reference method for in vitro hydrolytic degradation of implant polymers.
| ASTM F1635 | Carousel | |
|---|---|---|
| Mass read | Dry mass | Drained, hydrated mass |
| Readings | Set timepoints, by hand | Every timepoint, unattended |
| Samples | Each timepoint uses up its own | The same ones, left in their chambers |
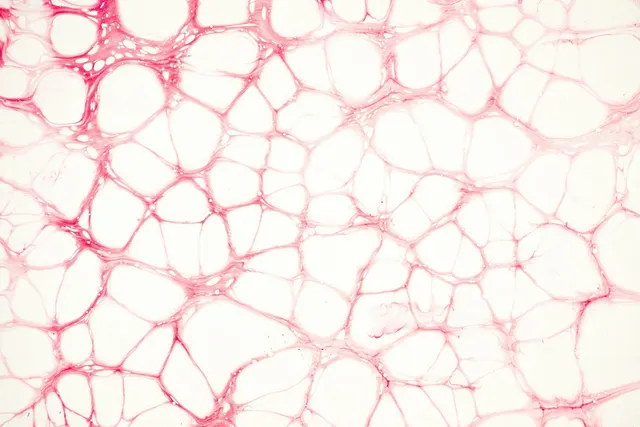
- 01
Uptake
Fluid enters at a rate set by crosslink density.
MeasuredMass from the first minutes.
- 02
Equilibrium swelling
Uptake stops when the network's elastic pull balances the swelling pressure.
MeasuredEquilibrium swelling ratio.
- 03
Degradation
Crosslinks break; the scaffold swells a little, then loses mass.
MeasuredHydrated mass through resorption.
Mass and mechanics, side by side
A resorbing scaffold hands load to new tissue, and its stiffness usually falls before its mass.
Illustrative
Illustrative chart of mass over time.
Illustrative
Illustrative chart of stiffness over time.
Stiffness (G′, G″ and compressive modulus) comes from separate samples at set timepoints, measured on integrated instruments and read beside Carousel's mass curve.
Implant and scaffold forms and materials
GelTech tests degradable rods, discs, printed scaffolds and hydrogel scaffolds, in polyesters such as PLGA, PLA and PCL and the hydrogels below. Runs go from ambient to 60 °C and pH 1.5 to 12, with enzymes or accelerated conditions to shorten a long degradation.
| Material | Category | What the test has to catch |
|---|---|---|
| Alginate hydrogel | Natural | Calcium swaps for sodium in the medium, so mass loss can start early. |
| GelMA hydrogel | Natural, modified | Swelling set by substitution and light dose; collagenase breaks it down. |
| Hyaluronic acid | Natural | High swelling; breakdown depends on hyaluronidase. |
| Collagen and ECM hydrogels | Natural | Fragile networks that hand blotting damages. |
| Chitosan | Natural | Swells more below about pH 6.5. |
| PEG and PVA networks | Synthetic | Ester-linked PEG degrades over months; crosslinked PVA barely degrades. |
ASTM F2900 guides hydrogel characterization for regenerative medicine.
What this testing doesn't cover
- Biocompatibility and device-level testing. We test the in vitro performance of degradable materials.
- Animal and clinical studies. We help choose the candidate; we don't run them.
How a degradation study starts
Get a dataset and report on your own material through a pilot study: ship us your formulation, or have us formulate it, and our R&D services team runs the study. Teams that test often can run the same methods on their own Carousel, with install, training and a 30-day trial.

Plan a pilot degradation study
Tell us the material and how long it should last.